What is a Running Curve |
Running curve is a graphical representation of track profile, train speed, position and time
running over the track.
It is also called a run-curve or a train performance curve.
This figure shows the typical run-curve.
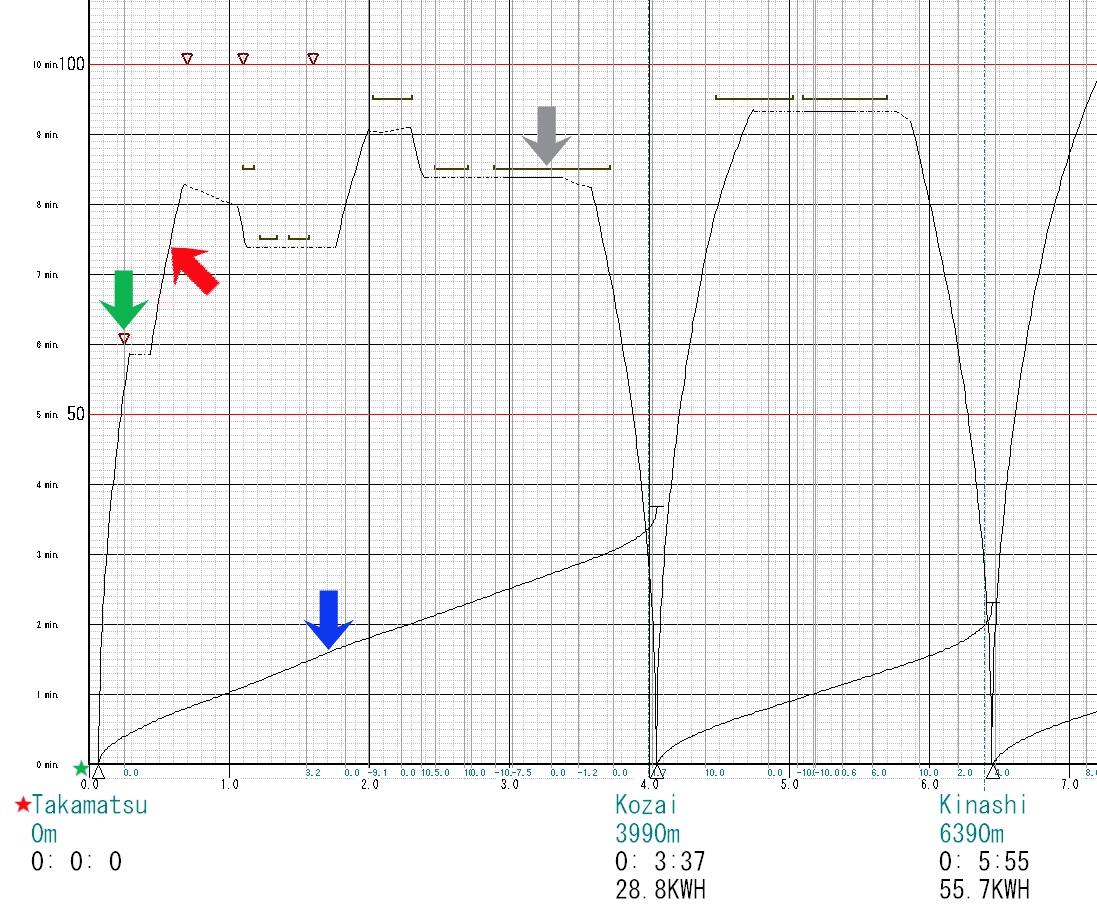
The vertical axis represents the train speed in km/h and time in a minute, the horizontal axis represents the train position from the starting station in km.
The red-arrowed curve represents the train head
position and speed.
The blue-arrowed curve represents the train head position
and time.
The green arrowed reversed triangle represents
the turnout position and its speed limit.
In this case, the turnout is located at 200m from Takamatsu station and the speed limit is
60km/h.
Red star marked Takamatsu is a station name, in this case, the starting station of this simulation.
The green stared triangle represents the head position of the train dwelling at the starting station.
The gray arrowed line represents the speed limit
and the section of the speed limit
In this case, from 2900m to 3740m, the train speed is limited to 85km/h.
Click here to go to the contents page.