Read a running curve |
The next graphs illustrate how the running curve displays the train's behavior.
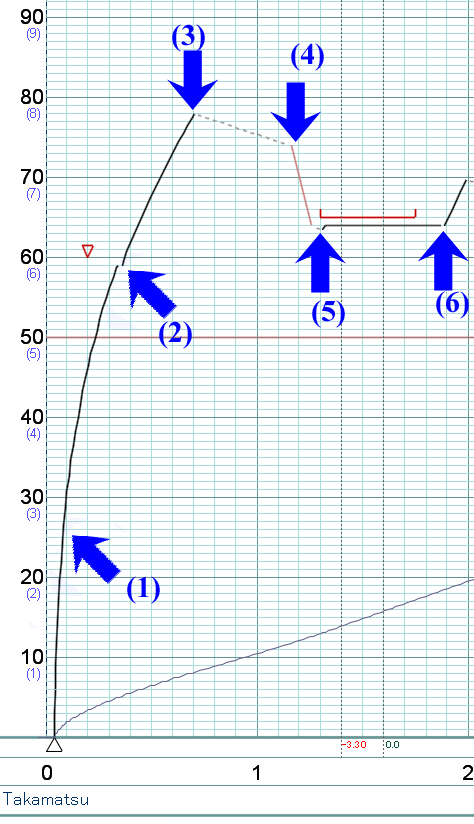 |
(1) The train is in powering mode and accelerating. |
(2) Power is saved not to over the speed limit of the turnout. After the tail of the train passes through the turnout, it turns into the full powering mode. |
|
(3) The train turns into the coasting mode because the next speed limit of the curve is coming closer. |
|
(4) The train turns into the braking mode to obey the speed limit of the curve. |
|
(5) Now the train speed is belowr the speed limit and the brake is
released.
|
|
(6) After the tail of the train passes through the speed limit, the train turns into the full powering mode and accelerate. |
|
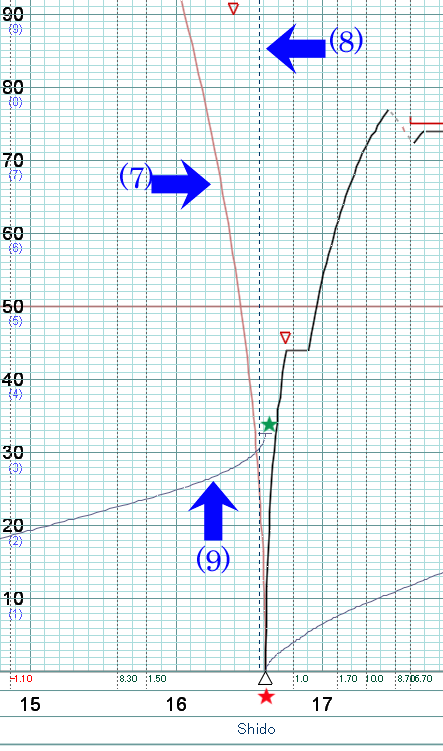 |
(7) The train is in the braking mode to stop the next station. |
(8) This dotted line indicates the center position of the station. Red stared triangle indicates the train position dwelling at Shido station. The distance between them is usually the half the length of the train, because the stopping position is calculated to put the center of the train and the center of the station together. |
|
(9) This is a time curve, representing the train head position and time from the previous station. You can get the time between stations to read the terminal end of this curve (green stared). In this case time is about 3 minutes 27 seconds. |
|
|
|
|
|
|
|
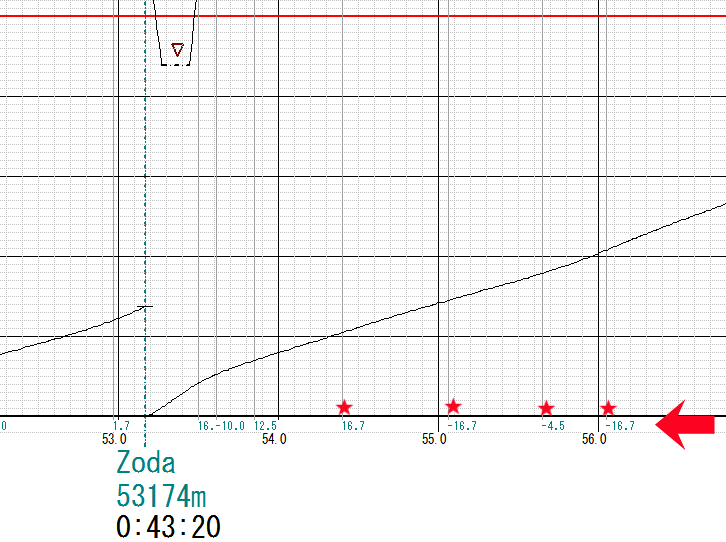
(10) The vertical profile of the track is shown in this area. The unit is permillage (‰). Red stared vertical lines represent the boundary of each slope.
Click here to go to the contents page.