Running Curve Window |
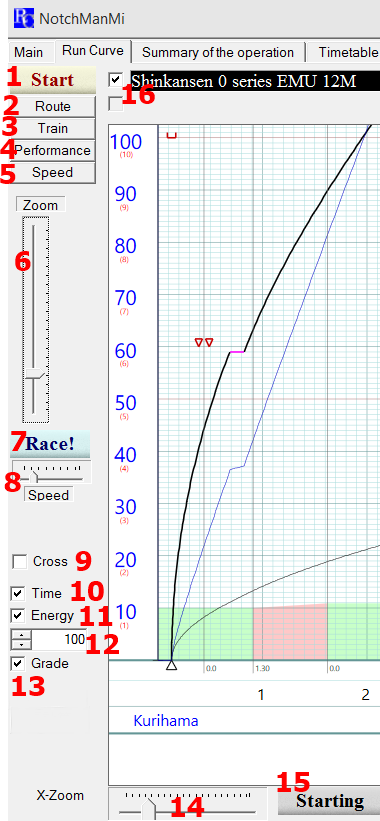
1 |
Start the wizzard. |
2 |
Change the route to simulate. |
3 |
Change the train to simulate. |
4 |
Change the train performance currently used. |
5 |
Change the operating speed currently used. |
6 |
Zoom the graph. |
7 |
Start the animation of the running curve. |
8 |
Control the animation speed of the running curve. |
9 |
Show or hide the cross lines cursor. |
10 |
Show or hide the distance-time curve. |
11 |
Show or hide the distance-energy curve. |
12 |
Adjust the scale of the distance-energy curve. |
13 |
Show or hide the vertical profile of the track. |
14 |
Zoom only the distance direction. |
15 |
Jump to the starting station. |
16 |
Choose the attention train. The speed limit to display in the window is selected for the train and while racing, the head point of the train is always shown in the window. |
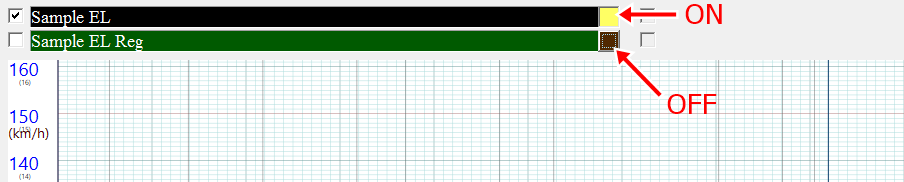
Buttons located at the tail of train title windows select the data curve
displayed in the running curve window.
If the button is off, the curve of the train is not displayed.
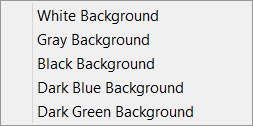
If you right click on the running curve window, the next menu pops up and you
can select the back groud color.
Items in this window
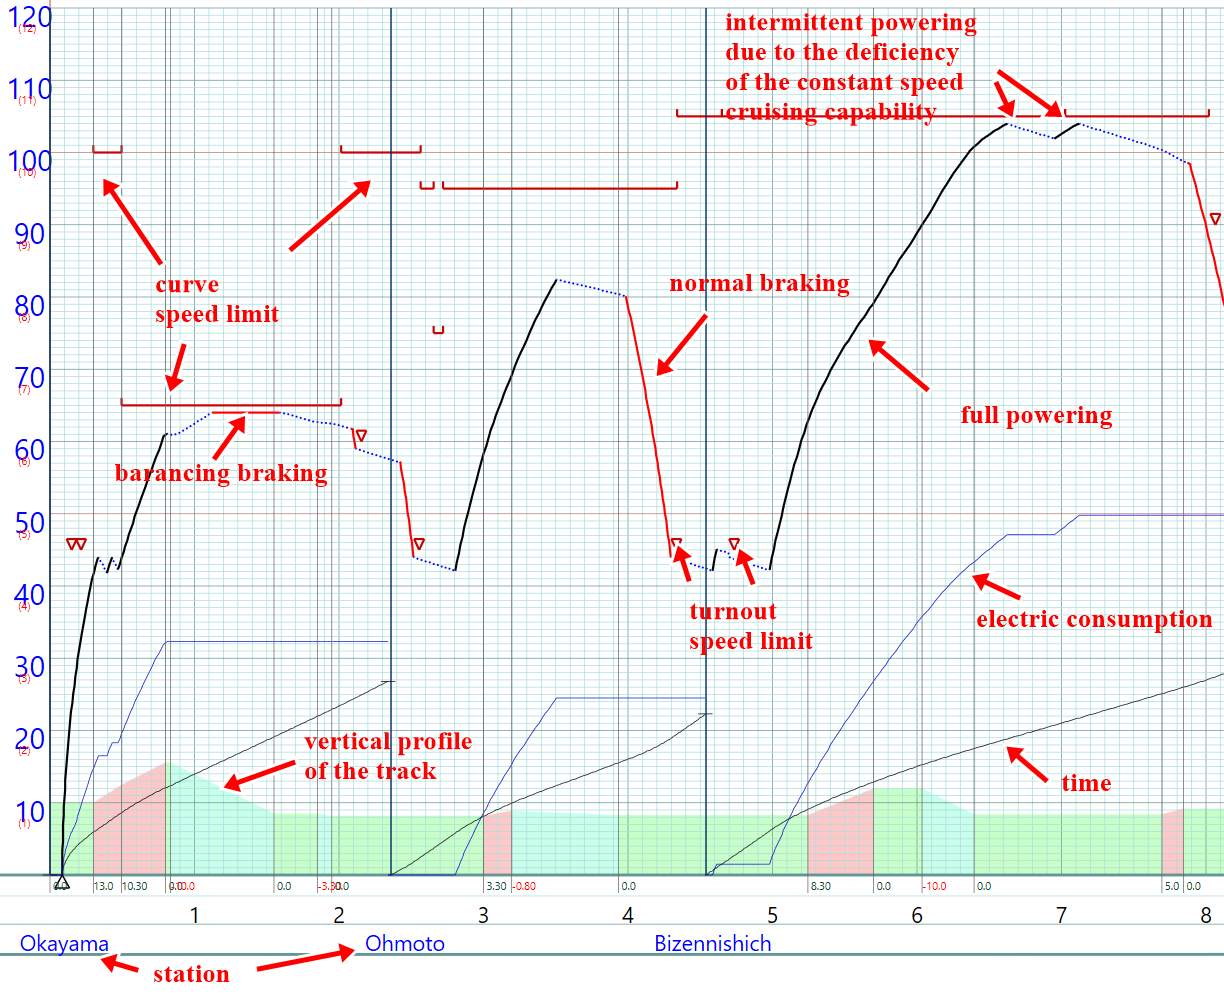
The scale of the vertical axis is used in common between the speed (km/h, mph) and the energy consumption (KWH, kg, lb).
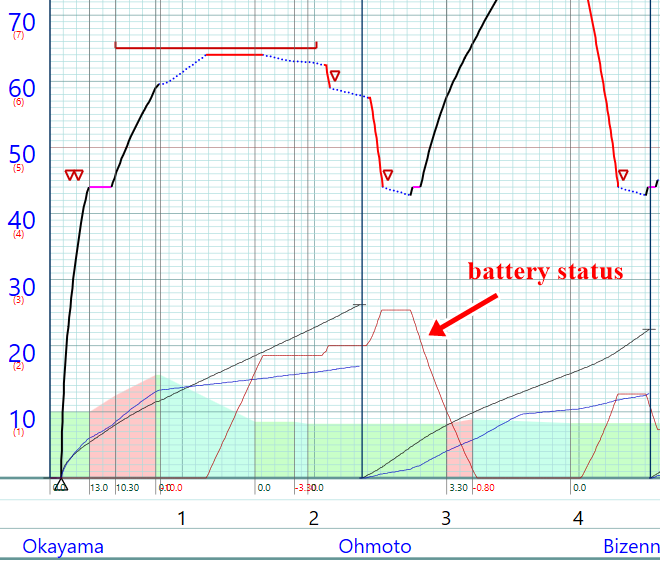
If the simulated train has the battery to regenerate the kinetic energy, the
battery charging status curve is added.
The charging status is shown % against the battery's practical capacity. The
practical capacity is calculated by
the full capacity and the D.O.D. value set by uses while creating imaginary
trains. #D.O.D. Depth of Discharge
Click here to go to the contents page.